

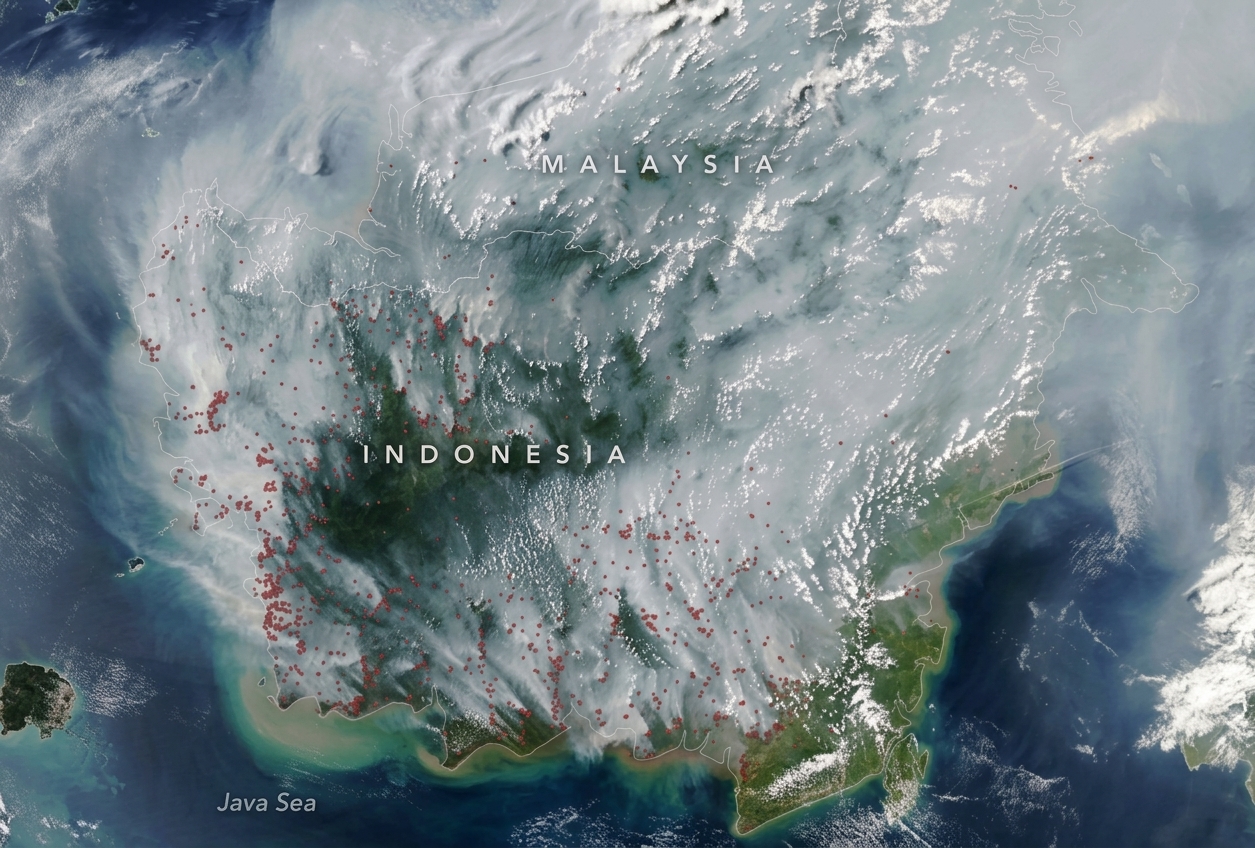
Indonesia is once again burning. Since July 2026, forest and peatland fires have swept across Kalimantan, pushing air quality in Palangka Raya to hazardous extremes and sending haze as far as the Philippines and Malaysia. The human toll is already staggering: from August to October there have been more than 283,000 recorded cases of acute respiratory infection (ISPA), according to the Ministry of Health. Some schools have closed or shifted to online learning, and the smoke shows no sign of clearing until the rains return.
Fires like these are not sudden or unpredictable. They follow a slow build-up in the peat itself, as groundwater drops and the organic material beneath the forest floor dries out enough to ignite. In theory, that gives responders a window to act before a fire starts, not just after the smoke appears. In practice, that window is only useful if the underlying landscape is properly mapped and continuously monitored — and peatland is exceptionally difficult to do either.
Indonesia holds the world’s largest expanse of tropical peatland, yet different institutions still cannot agree on how much of the country is actually covered by it. Estimates range from roughly 13 to 27 million hectares across Sumatra, Kalimantan, and Papua, reflecting the sheer difficulty of mapping a landscape defined by what lies beneath the surface rather than what’s visible from above. Peat is often hidden beneath dense forest canopy, its boundaries shift gradually rather than sharply, and its depth cannot be reliably estimated from satellite imagery alone. Overcoming these limits requires two distinct categories of technology: tools that map what’s already there, and tools that monitor how it’s changing in real time.
To understand both, the Gambut Kita team spoke with Associate Professor Hendrik Segah, an expert in remote sensing and environmental monitoring of peatlands, and director of the Center for the Development of Peatland Science, Technology, and Innovation (PPIIG) at the University of Palangka Raya (UPR). With Palangka Raya’s Air Quality Index reaching a hazardous 2268 that weekend, according to IQAir, we weren’t sure the interview would happen, but Dr. Segah was available.
Mapping the Peatland
We first asked Dr. Segah what technologies are available to map peatland, to address the questions: where is the peat, how deep is it and what the surface actually looks like?
We began with Light Detection and Ranging (LiDAR). Mounted on a helicopter or aircraft, a scanner fires millions of laser pulses to the forest. Most of them reflect off the tree canopy and some of them slip through small gaps and bounce back off the peat surface itself. As laser pulses fired from the aircraft bounce back, the lowest returns in each area are used to build a Digital Terrain Model (DTM) of the peat surface, while the highest returns build a Digital Surface Model (DSM) of the canopy top. Subtracting the DTM from the DSM at every point gives tree height across the entire forest. This reveals topography that optical satellite imagery simply cannot see through. Since 1997, UPR has run a series of Japanese government-funded research programs with Hokkaido University, including LiDAR surveys of Central Kalimantan’s peatlands in 2007 and 2011.
While LiDAR gives a picture of the peat surface and canopy, to measure peat depth, surveyors conduct drillings, which requires them to be on the forest floor itself. They drill straight down into the ground at set intervals along a transect, depending on the survey, until the probe reaches the mineral soil beneath the peat layer, giving a precise depth reading at that single point. Repeating this across dozens of points lets researchers reconstruct the shape of the peat surface across the whole transect. Peat dome slope is then derived from this same data: by taking the difference in surface elevation between two drilling points and dividing it by the distance separating them, researchers get a slope value that shows how steeply the peat dome’s surface changes across that stretch of ground.
The data from LiDAR scans and peat drillings are paired with satellite imagery to produce a peatland map of a given area, but because it’s ultimately built from sampled points and interpolated between them, it can never claim to be 100% accurate.
Dr. Segah also introduced us to spectroradiometry, a technology that detects the unique reflectance and wavelength signature different tree species produce when sunlight reflects off their leaves. Because it can distinguish between species this way, it can be used to map the tree species composition of a forest. The data is valuable not just for identifying what’s growing, but for tracking the progress of reforestation efforts over time. He is currently working on a paper applying the technique specifically to peatland tree species.
Monitoring the Peatland in Real Time
The second category answers a dynamic question: what is happening on the ground right now, and is it trending toward danger?
Dr. Segah opened with a question of his own: “From where I am sitting, I can monitor the groundwater level, temperature, humidity and rainfall of four specific locations. How do you think that is possible?”
“Someone on-site tells you?” I guessed.
“No, we’re far more advanced than that now.”
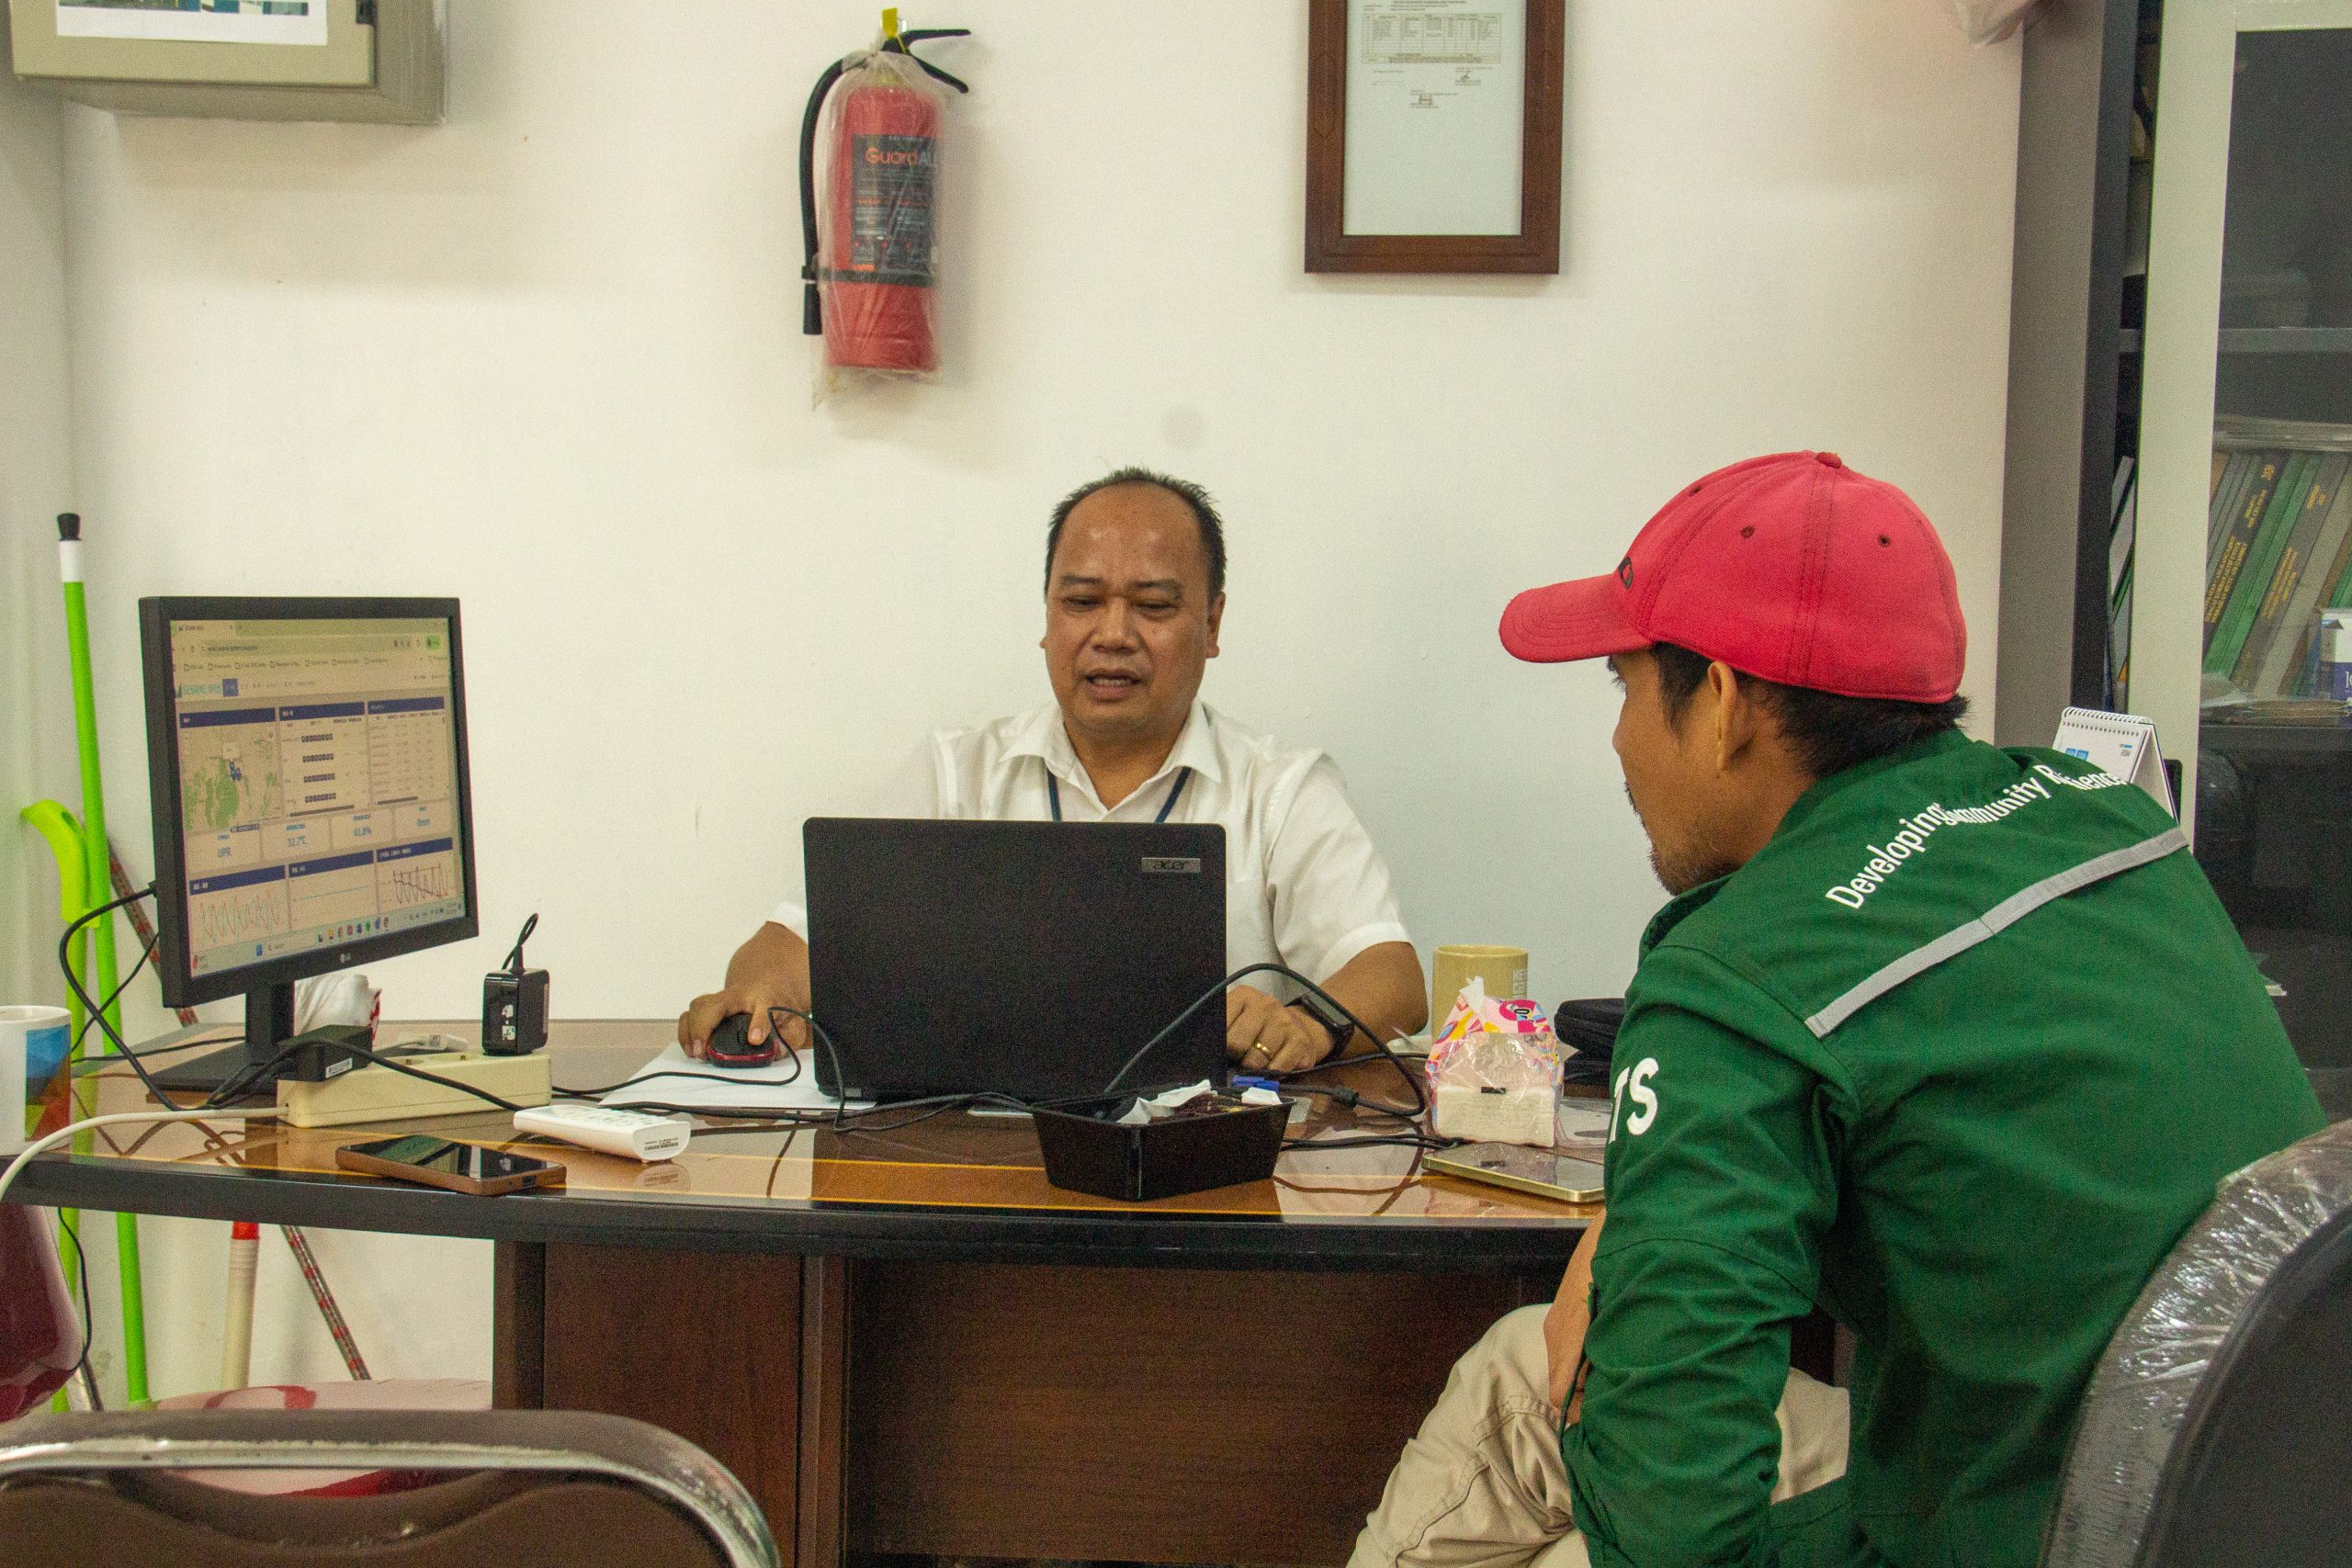
He pulled up the system on his laptop, pointing to the temperature and humidity of Taruna village, 31°C and 66%, against a station in the Sebangau forest, reading 24°C and 95%. There are two more stations, one in Hokkaido and one in the forest within UPR’s own campus grounds, Each gives real-time data on groundwater level, temperature, humidity, and rainfall, and photographs its location every hour. Hokkaido University developed this system, called SESAME.
Indonesia’s own national system, SiPongi+, run by the Ministry of Environment and Forestry, pulls real-time hotspot data from NASA and NOAA satellites, layering in weather conditions, peatland water levels, and burned-area estimates. Each detected hotspot carries a confidence score, since satellite-detected temperature anomalies still require ground verification to confirm an actual fire. While SiPongi+ indicates hotspots at a national scale, SESAME monitors environmental conditions on the ground, continuously, at a handful of precise locations. It logs groundwater levels at each station, and when the data shows a sustained downward trend, it gives an early warning before the peat becomes dry enough to ignite.
The Gap Between Data and Action
Indonesia’s Meteorology, Climatology, and Geophysics Agency (BMKG) warned the public months in advance that this year’s El Niño would be severe, bringing an exceptionally long drought. But early warning only matters if it’s followed by early funding. In Indonesia, disaster budgets have historically been triggered by the fires themselves, not by the forecasts that predicted them. LiDAR, peat drilling, satellite hotspot detection, real-time ground sensors, and spectroradiometry. Surely, all this technology and data is enough to anticipate peatland and forest fires?
“We already had the data to prepare and technology will continue to develop,” Dr. Segah added. “But it has to lead to implementation, not just monitoring. It’s not enough to just watch and record data without any action following it. What we need is integration; coordination and synergy between all parties involved.”
Before we parted ways, the director showed us the information center on the lower floor. There were display cases of peat, the actual spongy organic matter we had spent the last three hours discussing. There were local products made from materials sourced from peatland environments. Information displays traced the ecology, flora, and fauna of the peat swamp.
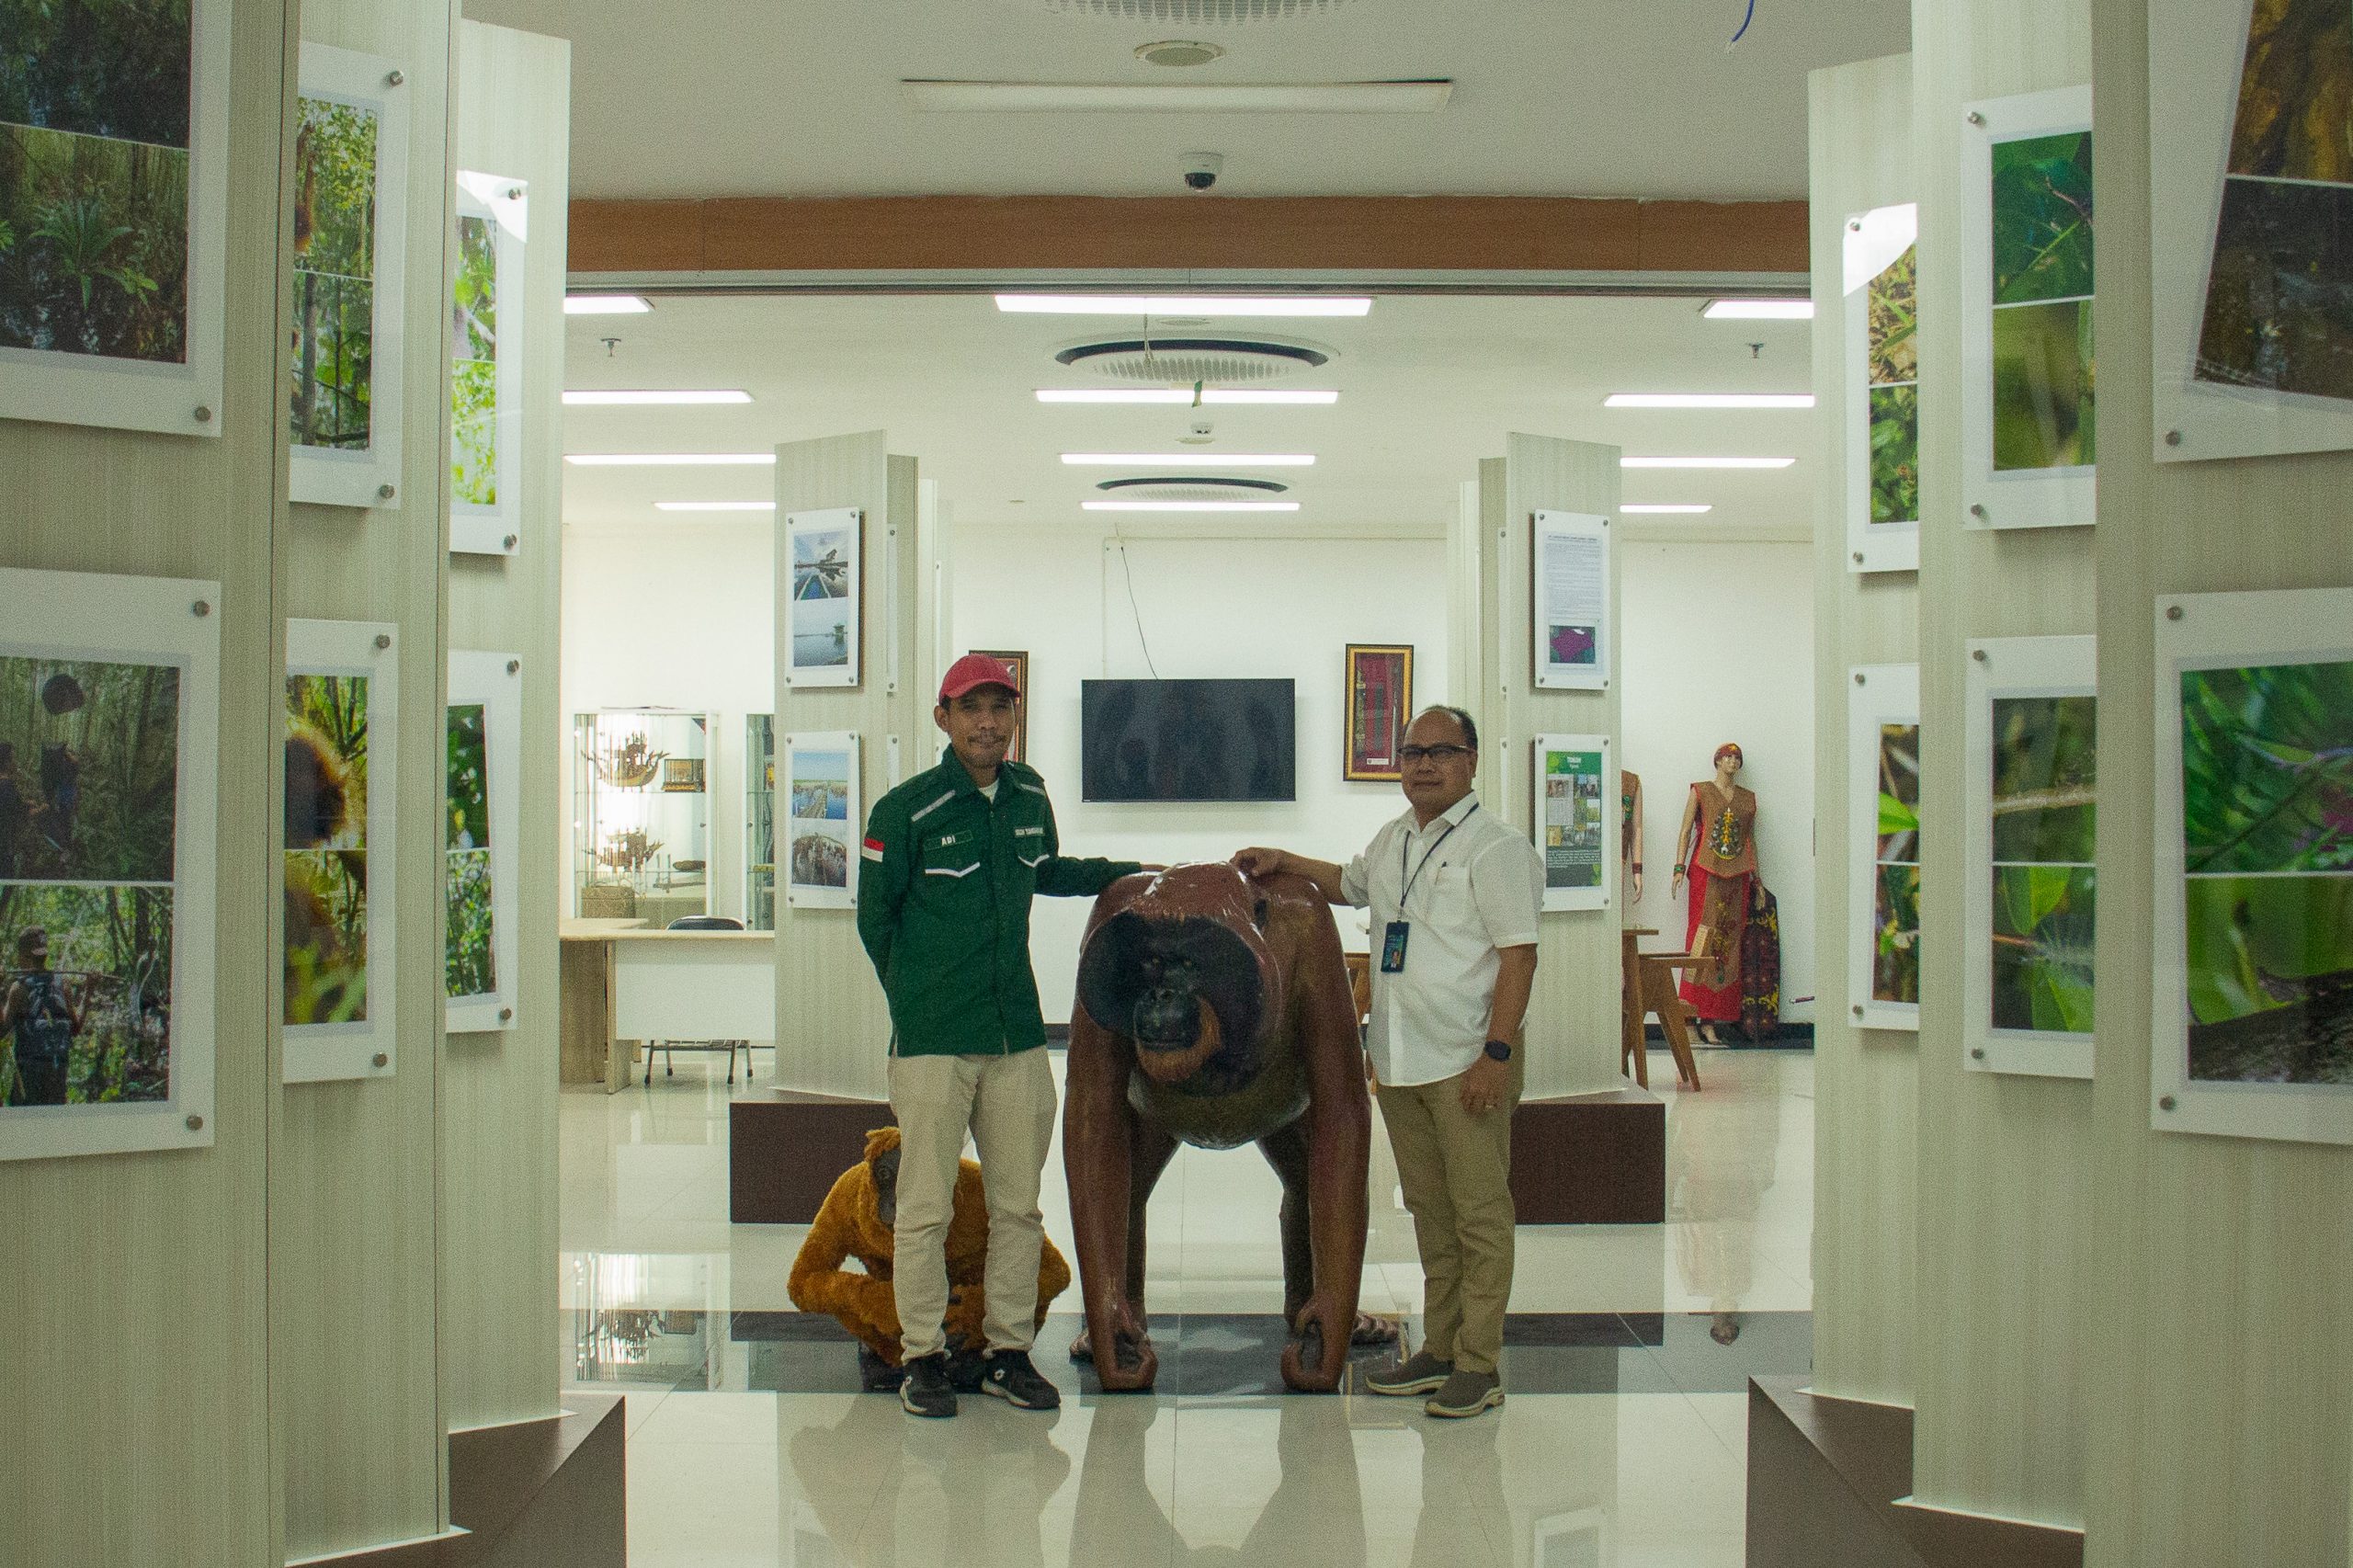
Standing among all of it, it was easy to see what Dr. Segah had meant earlier: there is no such thing as a peat expert, only people who bring their own field, whether that is sociology, economics, remote sensing, biology, forestry, to the peatland context. That is exactly what PPIIG is for: bringing all those disciplines together under one roof, in service of peatland science, technology, and innovation. It is a small-scale model of what peatland restoration needs at a much larger scale — government, researchers, local communities, and industry, each contributing their own expertise, working in partnership rather than in isolation. Peat fires are rarely a failure of any single discipline; they are a failure of coordination between all of them.